For the first time, the climate crisis is also becoming noticeable for us and especially in Southern Europe: as a water crisis. Weather conditions are continuing to be determined. There are long periods of drought or hot high-pressure weather conditions. This means that heavy rain stays down for hours and unlocks incredible amounts of water.
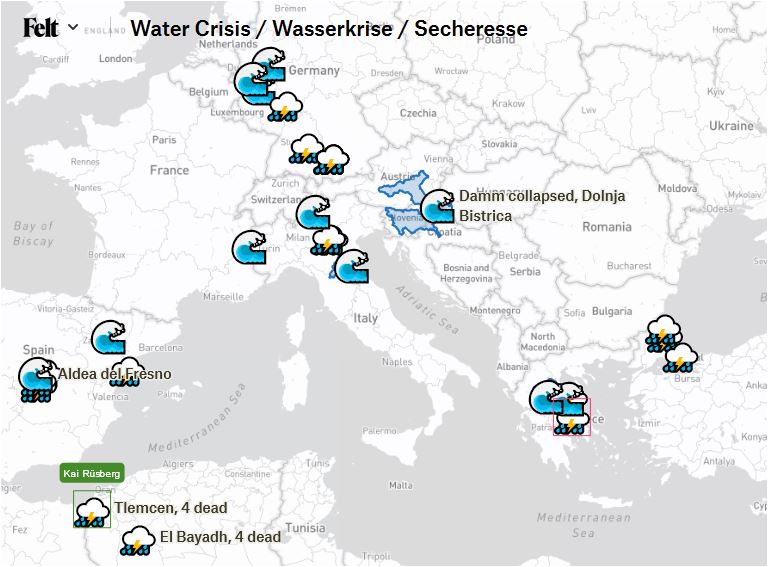
It is now clear that the water crisis threatens us existentially, it causes our infrastructure to collapse. Examples include the devastation caused by the river Ahr old July 2021 or Slovenia July 2023.
Only a temporary peak was the day-long storms around Greece in September with the largest rainfall levels of 1000 mm each measured in 24 hours. People died, fields were underwater, harvests are destroyed, cattle drowned.
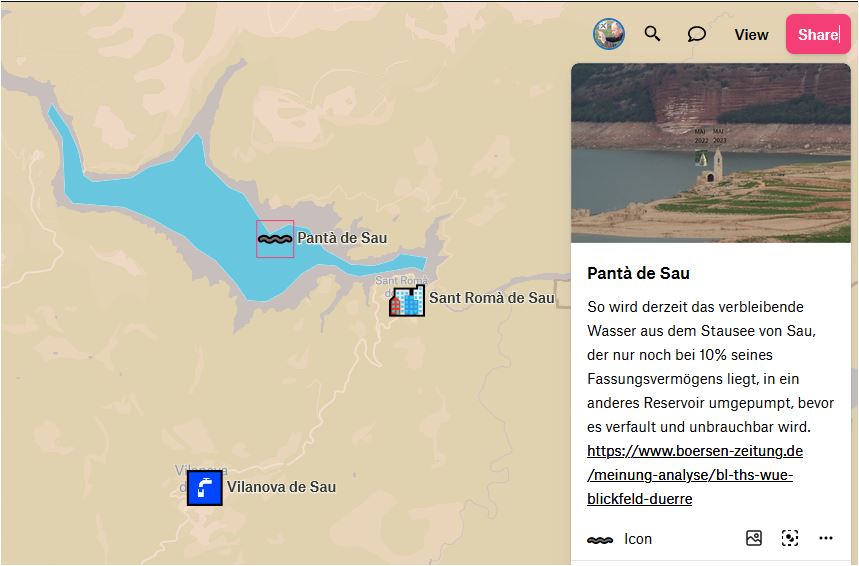
The water crisis has a creeping but long-lasting effect on our living conditions. The harvests will be suitable or the water will no longer flow out of the pipe. We are experiencing both for the first time at the same time in 2023.
Contradictory news
As a journalist, I am aware of the greatest shortcoming of the presentation of crises in public. It is reported as a big news, sometimes excessively over a short period of time, and then the interest will be felt again. At the next event, an even greater impulse is needed to report again. News always need relevance, sensation or comparative: bigger, worse, more consequential.
The water crisis is therefore difficult for the public to understand throughout the threat. Because the isolated data act contra-fus and can be difficult to capture in the totality, they appear to be not linked. Events of the water crisis are mostly presented in news as singular disasters or weather capricious.
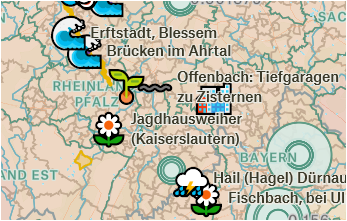
Map creates a view
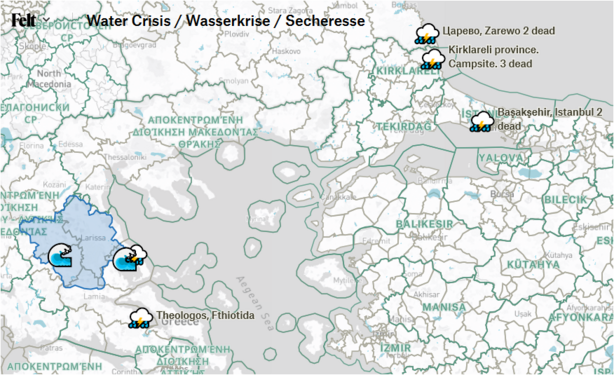
My project Mapping the water crisis – Throughout the climate crisis should help here:
more transparency, more perspective, more linking.
The places of the water crisis are represented on a map, with slightly understandable symbolism and sound facts.
Link: Interactive prototype (felt.com)
Helping to document the water crisis
For this purpose, data is to be generated continuously in a multi-annual programme, with the help of the crowd or Citizen Science. For the time being, I have created a prototype of the map based on reports in the media. There are already dozens of events in the water crisis.
If you want to know more about the background, you can read it here on the project page and also participate: